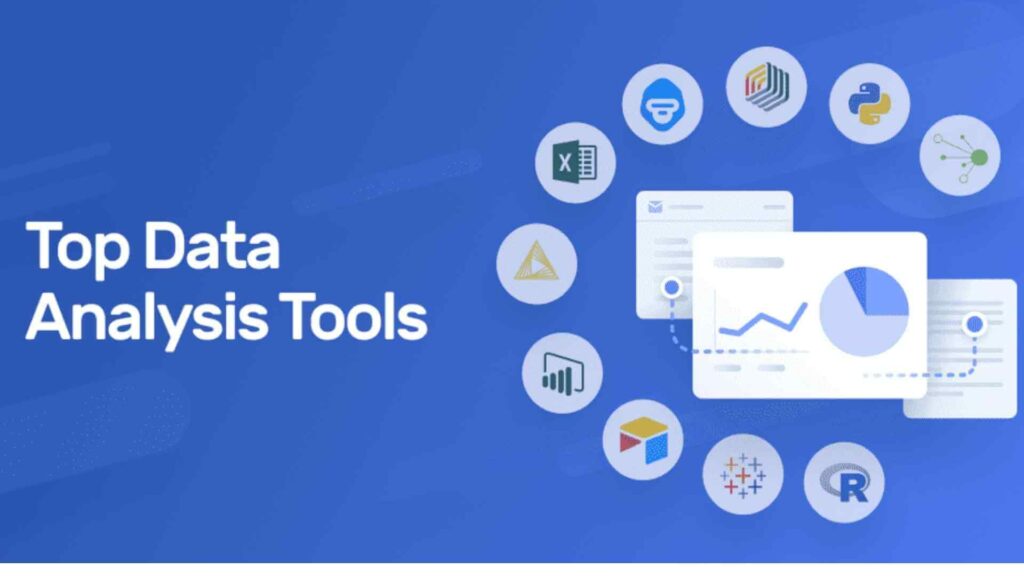
Data Analytics Tools
Data analytics tools are essential for analyzing, visualizing, and interpreting data to uncover insights and make informed decisions. Below is a list of must-learn data analytics tools categorized based on their functionalities, ease of use, and industry popularity.
1. Programming Languages for Data Analysis
1. Python
- Why Learn It: Python is one of the most popular languages for data analytics due to its simplicity and vast libraries.
- Key Libraries:
- pandas (data manipulation)
- NumPy (numerical computing)
- Matplotlib and Seaborn (data visualization)
- scikit-learn (machine learning)
- Statsmodels (statistical analysis)
- Applications: Data cleaning, visualization, machine learning, and predictive modeling.
2. R
- Why Learn It: R is specifically designed for statistical computing and graphics, making it ideal for statistical modeling and visualization.
- Key Packages:
- ggplot2 (visualization)
- dplyr and tidyr (data manipulation)
- caret (machine learning)
- Shiny (interactive dashboards)
- Applications: Statistical tests, regression analysis, and data visualization.
2. Data Manipulation and Querying Tools
3. SQL (Structured Query Language)
- Why Learn It: SQL is the most important tool for querying and managing relational databases. It’s widely used for extracting data for analysis.
- Key Features:
- Query databases
- Filter and join datasets
- Perform aggregation and sorting
- Applications: Data extraction, transformation, and database management.
4. Microsoft Excel
- Why Learn It: Excel remains a fundamental tool for data analysis and reporting, especially for beginners.
- Key Features:
- Pivot tables
- Data filtering and sorting
- Built-in statistical functions
- Add-ins like Power Pivot for advanced analysis
- Applications: Budget analysis, forecasting, and quick data manipulation.
3. Data Visualization Tools
5. Tableau
- Why Learn It: Tableau is a powerful tool for creating interactive and shareable dashboards.
- Key Features:
- Drag-and-drop interface for visualization
- Integration with databases and spreadsheets
- Supports real-time data analysis
- Applications: Business intelligence dashboards, KPI tracking, and data storytelling.
6. Power BI
- Why Learn It: Developed by Microsoft, Power BI is widely used for building interactive dashboards and reports.
- Key Features:
- Seamless integration with Microsoft products
- AI-powered insights
- Real-time data updates
- Applications: Business intelligence, reporting, and visual analytics.
7. Google Data Studio
- Why Learn It: A free, cloud-based tool for creating interactive dashboards and visual reports.
- Key Features:
- Integration with Google Analytics, BigQuery, and Sheets
- Drag-and-drop interface
- Real-time collaboration
- Applications: Marketing data analysis and performance reporting.
4. Statistical and Machine Learning Tools
8. SAS (Statistical Analysis System)
- Why Learn It: SAS is highly regarded for statistical analysis and predictive modeling.
- Key Features:
- Advanced statistical procedures
- Machine learning and AI integration
- Robust for handling large datasets
- Applications: Forecasting, clinical trials, and risk analysis.
9. IBM SPSS
- Why Learn It: SPSS is widely used for statistical analysis in social sciences and business.
- Key Features:
- Easy-to-use interface for statistical modeling
- Regression and clustering analysis
- Machine learning algorithms
- Applications: Survey analysis, market research, and academic research.
5. Big Data Tools
10. Apache Hadoop
- Why Learn It: Hadoop is designed for processing and analyzing massive datasets across distributed systems.
- Key Features:
- Distributed storage and processing
- Integration with machine learning frameworks
- Scalable for handling big data
- Applications: Big data storage and batch processing.
11. Apache Spark
- Why Learn It: Spark is faster than Hadoop and supports in-memory data processing.
- Key Features:
- Machine learning library (MLlib)
- Real-time data streaming
- Compatibility with Python and R
- Applications: Big data analytics, machine learning, and stream processing.
6. Data Cleaning and Preprocessing Tools
12. OpenRefine
- Why Learn It: OpenRefine is a free tool specifically designed for cleaning messy datasets.
- Key Features:
- Identify and fix inconsistencies
- Data transformation and filtering
- Supports large datasets
- Applications: Cleaning and preparing data before analysis.
13. Alteryx
- Why Learn It: Alteryx simplifies data preparation and blending through automation.
- Key Features:
- Workflow-based drag-and-drop interface
- Integration with databases and cloud platforms
- Built-in predictive analytics tools
- Applications: Data transformation, blending, and ETL (Extract, Transform, Load) processes.
7. Cloud-Based Analytics Tools
14. Google BigQuery
- Why Learn It: BigQuery is a cloud-based data warehouse designed for large-scale data analytics.
- Key Features:
- Handles big data efficiently
- SQL-based querying
- Integrates with Google Cloud AI tools
- Applications: Big data storage and analysis in real time.
15. AWS QuickSight
- Why Learn It: Amazon’s cloud analytics service provides quick insights with minimal setup.
- Key Features:
- Scalable for large datasets
- Machine learning integration
- Real-time dashboard updates
- Applications: Cloud analytics and reporting.
8. Machine Learning and AI Tools
16. TensorFlow
- Why Learn It: TensorFlow is an open-source framework for machine learning and AI models.
- Key Features:
- Neural network modeling
- Deep learning applications
- Scalability for large datasets
- Applications: Image recognition, natural language processing, and predictive modeling.
17. RapidMiner
- Why Learn It: RapidMiner provides tools for data preparation, modeling, and machine learning.
- Key Features:
- Visual interface for building ML models
- No programming knowledge required
- Pre-built algorithms and workflows
- Applications: Predictive analytics and machine learning.
Final Thoughts
Becoming a successful data analyst requires familiarity with a range of tools tailored for data cleaning, analysis, visualization, and machine learning. Start with beginner-friendly tools like Excel, SQL, and Tableau, then progress to advanced tools like Python, R, TensorFlow, and Apache Spark for machine learning and big data analytics. The more tools you master, the more versatile and effective you’ll become as a data analyst.